SPaTo Visual Explorer
Many depictions of complex networks provide a rough impression of the network and are quite visually striking. Algorithms such as spring layouts are often used to determine node positions and try to convey information encoded in the network structure. However, due to the heuristic nature of those algorithms, the resulting layout does not carry any precise meaning. The problem is of course of fundamental nature, as most complex networks are high-dimensional objects that are not embeddable in a 2-D (or 3-D) space. In contrast, geographically embedded networks can be shown on a map with node positions precisely based on the network's geography, but this graph layout does not carry any information about the network structure itself.
In this project, we develop a new visualization method in which the node positions are precisely based on network properties. Typically, networks are reduced to their minimum spanning tree to obtain a planar subgraph, but here we propose to use the shortest-path tree of some specified node instead. This way we do not only obtain a graph that is embeddable in 2-D space but also provides a canonical distance between each node and the (selected) root node that can be used to determine node positions in the layout, namely the shortest-path distance. The network is then plotted by placing the root node into the center of the picture and arranging all other nodes around it in a radial fashion where the radial distance corresponds to the shortest-path distance to the root node and the angular position is determined by the hierarchy, or structure, of the tree.
The resulting image is a local view of the full network, as observed by the selected root node. By selecting different root nodes we can see various such slices of the network, which in their entirety yield a diverse and (almost) comprehensive view of the network. We developed an open-source software tool, available at www.spato.net, which is able to create such visualizations and allows to interactively explore complex networks. Documentation and an example network are also available on the website.
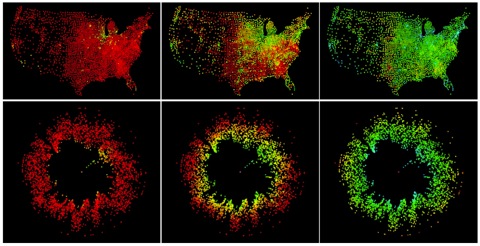
When dealing with transportation or contact networks, in which the link weights correspond to an interaction strength such as number of travelers between two places or number of contacts between two people, it is intuitive to define an affinity measure between two nodes that is the inverse of the link weights. Thus, two places (or persons) are “close” to each other, or affine, if they have a strong link between them. The shortest path between two nodes then is the path that minimizes the sum of the inverse weights of the links along the path, and the shortest-path tree of some selected node is the union of the shortest paths from that node to every other. The resulting picture using our visualization method and these shortest-path trees not only accurately reflects the properties of the shortest-path tree (and hence, indirectly, the network structure) in its node positions, but also carries further quantitative meaning as is shown in Figure 1.
Figure 1: Snapshots of the spread of a disease
within the United States. Disease dynamics exhibit
geographically very complex patterns. However,
visualized using our method with radial distance
corresponding to “effective” network distance, that is
the shortest-path distance to the central node, the
same process appears more akin to a one-dimensional
diffusion process.
